
Transparent Approach to Costing (TRAC) and financial sustainability academic years 2022-23 and 2023-24
Purpose
- This publication is intended to provide an overview of Scottish Sector Level Transparent Approach to Costing (TRAC) data and commentary for the 2022-23 and 2023-24 academic years. The document also discusses the high-level findings from this data, in particular as they relate to the Financial Sustainability of the Higher Education Sector in Scotland.
- The data in this publication is extracted from the wider TRAC data set as published by the Office for Students (OfS) at UK level for 2022-23 and for 2023-24 academic years.
Scottish sector-level TRAC1 data 2022-23 and 2023-24 academic years
- Our understanding of the performance and financial sustainability of Scotland’s universities can be enhanced by considering the recovery of full economic costs and income crossflows across activities within an institution, highlighted through the TRAC data. The Office for Students (OfS) collects TRAC data from all UK universities annually and publishes the official statistic. The Scottish Funding Council (SFC) provides assurance on the data provided by institutions in Scotland prior to the publication of the official statistic and is part of the UK wide governance of TRAC with other funders and provides support in the development of the TRAC guidance each year. SFC also reports Scottish TRAC data annually.
- It is important to take a multi-year view of TRAC results as the adoption of the FRS 102 accounting standard has resulted in greater volatility in reported surpluses or deficits across the sector. Care needs to be taken when comparing the results year-on-year as the number of institutions contained in the TRAC data can vary between years. Therefore, a directional analysis/view rather than direct comparison is appropriate at the Scottish and UK level.
- Scottish universities recovered 98% of Full Economic Costs (total expenditure plus a Margin for Sustainability and Investment (MSI) in 2022-23. However, the position varies across universities. The recovery percentage for the UK as whole was 94% slightly lower than the level of recovery in Scotland. For 2023-24, the recovery percentage for the UK as whole was 96% in line with the Scottish rate of full economic cost recovery which is also 96% for the same year.
- The table below shows the build‐up of full economic costs (FEC) with the inclusion of the MSI reflecting the costs of maintaining infrastructure and the return required for finance and investment. The MSI reflects a university’s own circumstances and is forward looking, with forecast information included in the calculation. The MSI adds £353m to the reported costs, representing 7.5% of total income (2021-22: £351m, 7.2% of income). The MSI for 2023-24 adds £316m to reported costs representing 6.4% of total income.
| Construction of Scottish sector Full Economic Costs 2022-23 and 2023-24 | ||||
|---|---|---|---|---|
| 2022-23 Total £m | % of income | 2023-24 Total £m | % of income | |
| Total income per audited financial statements for 2023-24 (a) | 4,703 | 4,938 | ||
| Total expenditure per audited financial statements for 2023-24 (b) | 4,458 | 4,822 | ||
| Operating surplus/(deficit) per financial statements | 245 | 5.2% | 116 | 2.3% |
| Margin for Sustainability and Investment (c) | 353 | 7.5% | 316 | 6.4% |
| Full Economic Cost per TRAC (b) + (c) | 4,811 | 5,138 | ||
| FEC Surplus/(deficit) per TRAC | (108) | -2.3% | (200) | -4.1% |
| N.B.: TRAC takes total income and expenditure figures from annual financial statements with adjustments to compensate for technical accounting entries such as changes in pension provisions. | ||||
Total Income and Full Economic Cost by Activity
- The graphs below shows total income and full economic cost (FEC) for the categories of university activity in 2022-23 and 2023-24. It also shows the recovery of Full Economic Cost (income as a percentage of FEC) for each activity for Scotland and for the UK as a whole for each of the academic years.
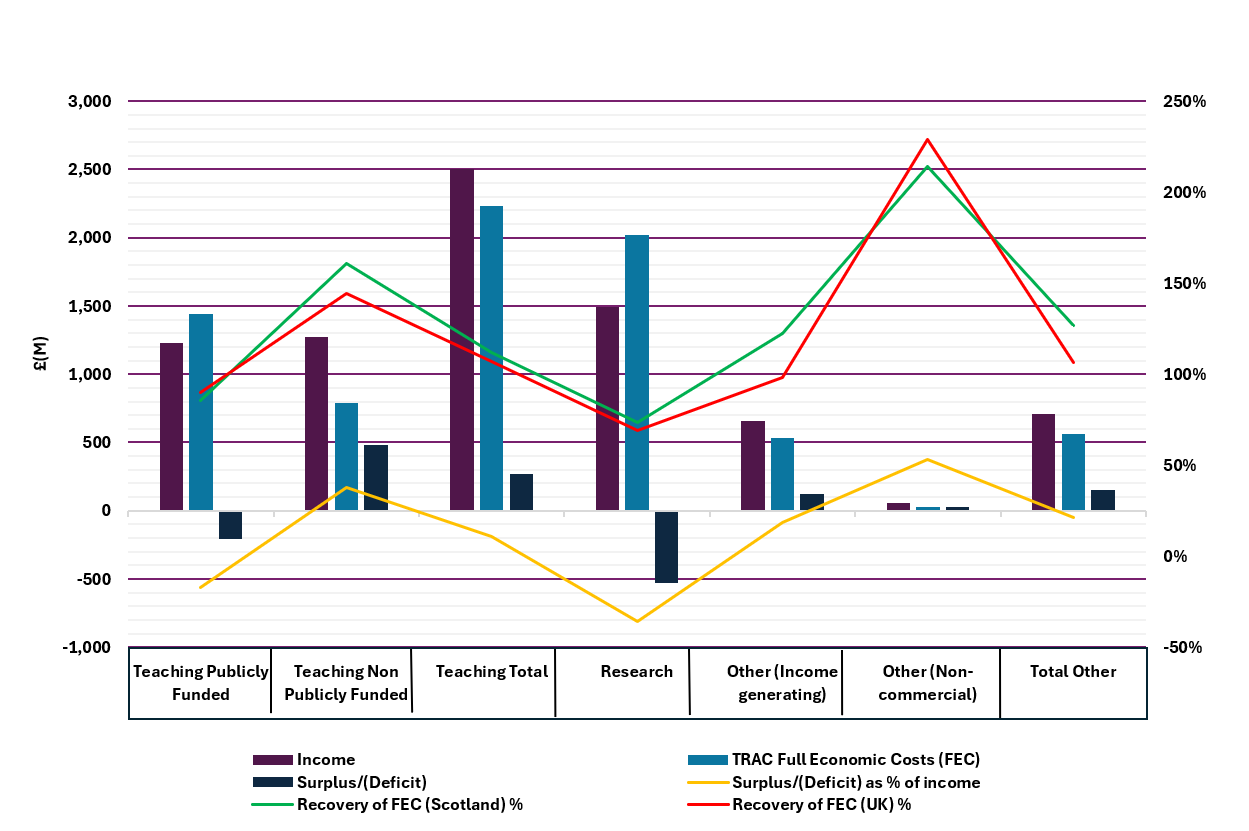
- In 2022-23, Scotland is performing slightly better than the UK as a whole, in recovering FEC on non-publicly funded teaching, research activities and other income-generating activities. However, Scotland still falls short of 100% recovery on publicly funded teaching and research.
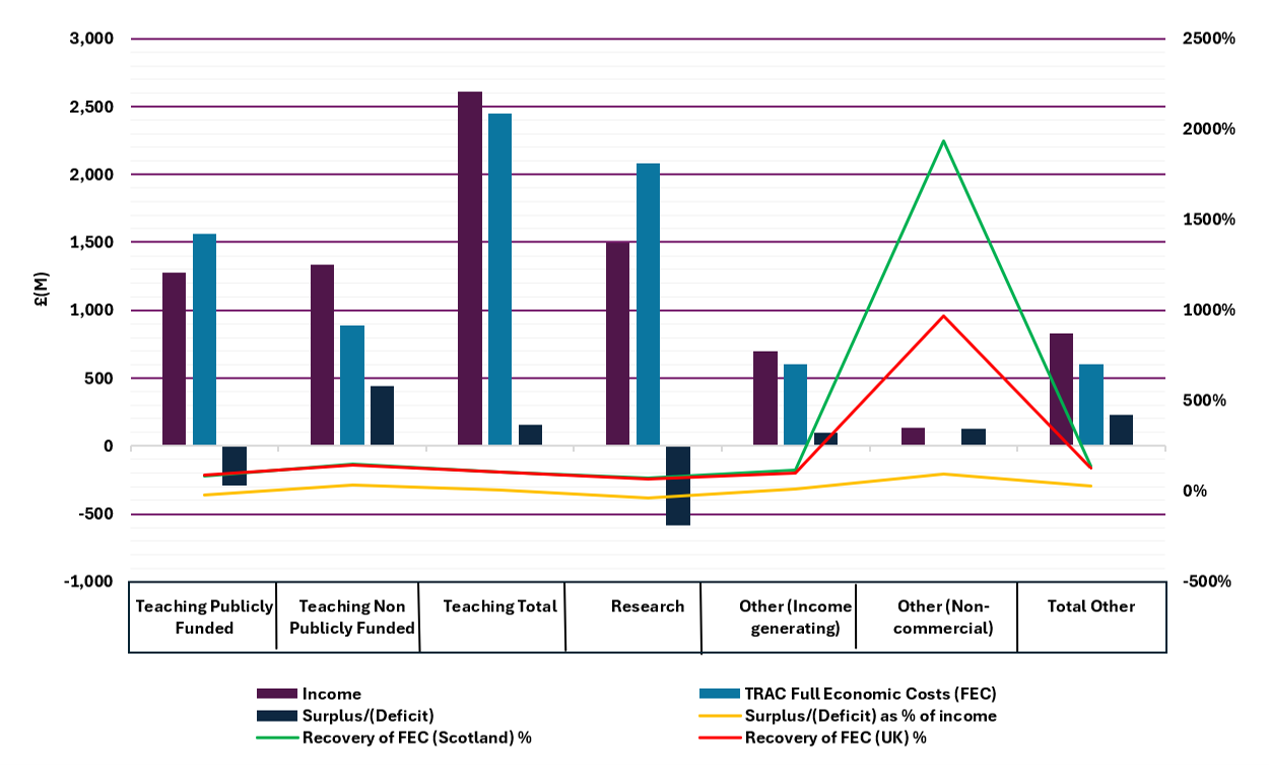
- In 2023-24, Scotland is performing very slightly better than the UK as a whole in recovering FEC on non-publicly funded teaching, research activities and other income-generating activities. By comparison to 2022-23 the gap between Scottish and UK cost recovery has narrowed.
- Across both academic years, Scotland still falls short of 100% recovery on publicly funded teaching and research. As a result, privately funded teaching and other income generating activities subsidise other activities which do not recover all of the full economic costs attributable to them.
UKRI Sankey Diagrams for 2022-23 and 2023-24
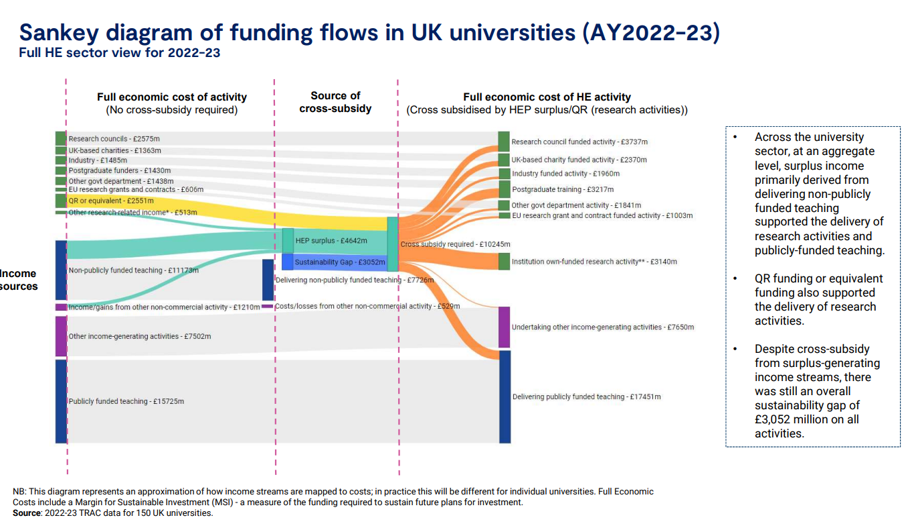
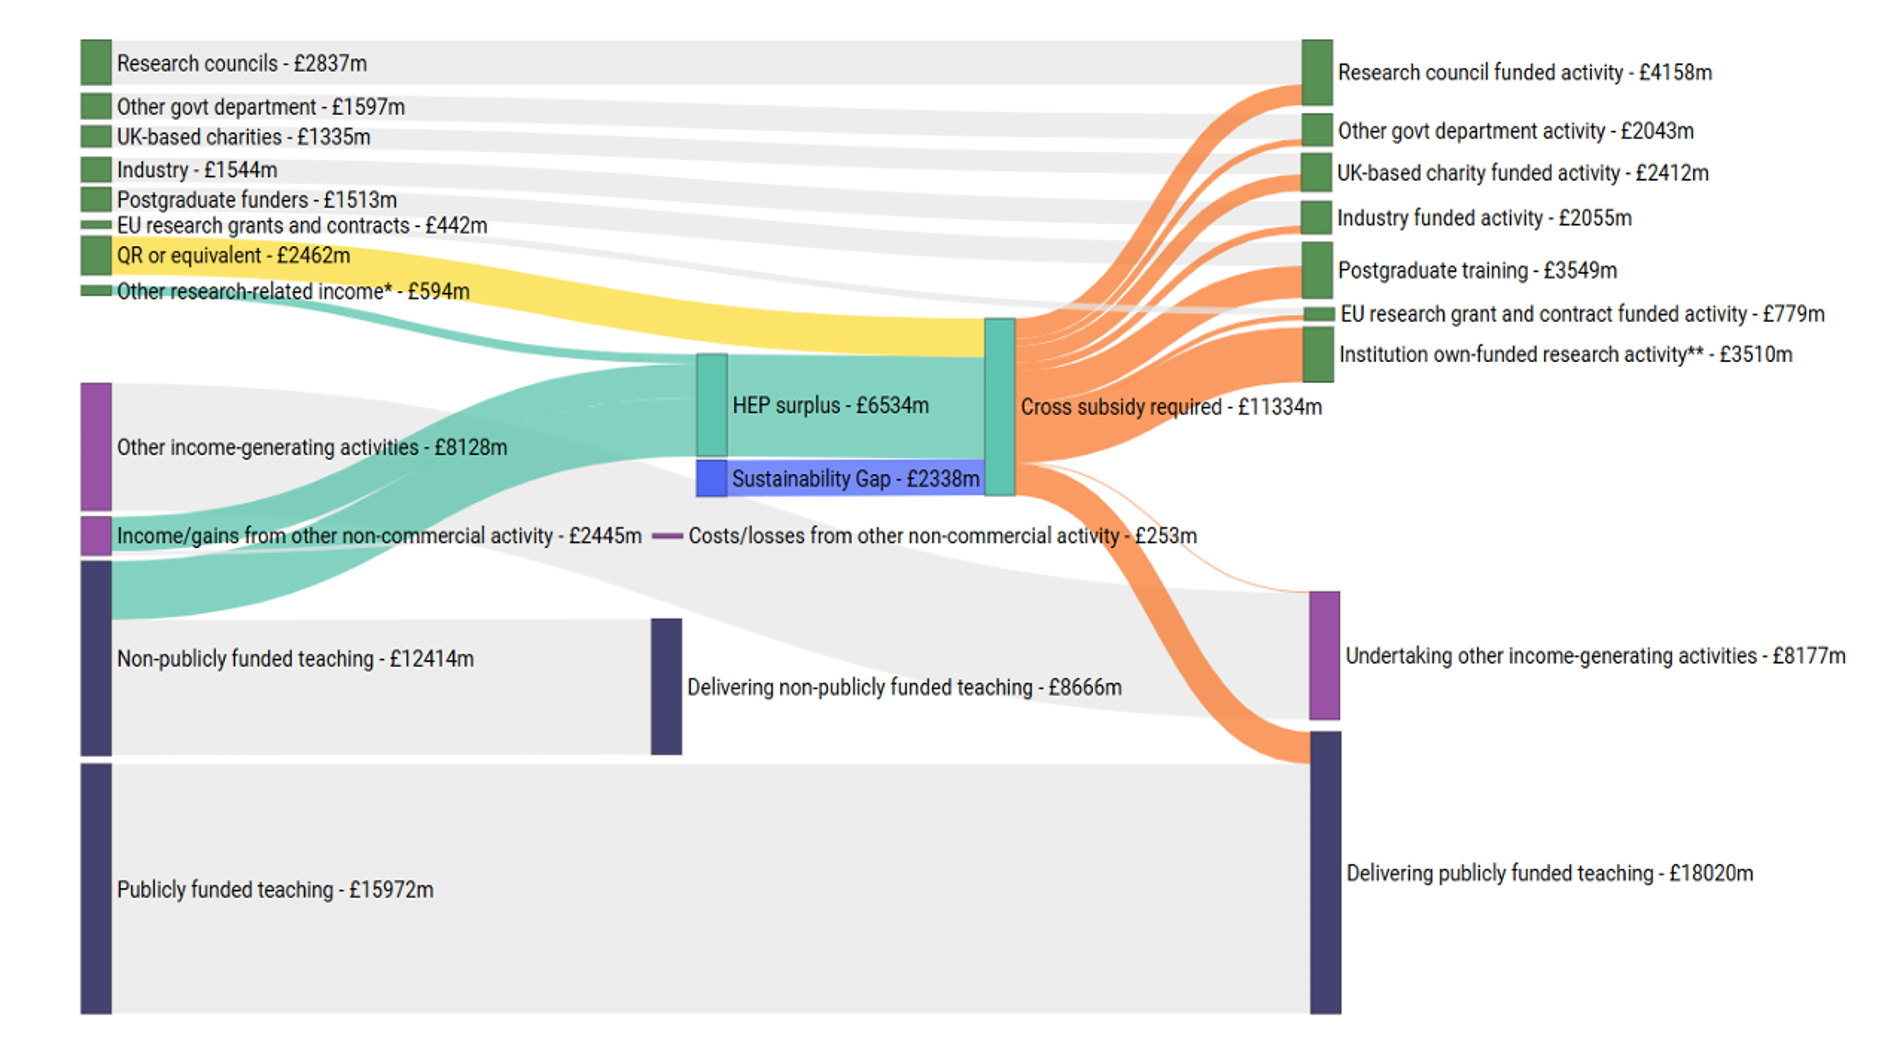
- The diagrams below shows how income streams from surplus-generating activities support activities that do not cover their full economic costs (at a UK level) in 2022-23 and 2023-24. This pattern of supporting activities that do not cover their full economic costs has been evident in both Scotland and the UK for several years.
Source – UK Research and Innovation
- The support of loss-making research by cross-subsidy from surplus-generating activities should be seen as part of an interconnected set of university activities. It is a strategic ambition of leading Scottish universities to be positioned on the global stage and to be peers with world class universities. In addition, the international research reputation of universities and their position in league tables impacts on the recruitment of international and domestic students. The surplus from international students (included in the non-publicly funded teaching income) assists with the sustainability of research activity and other activities that do not cover their full economic costs. Research reputation drives other income and strengthens staff recruitment and business relationships through knowledge exchange. Therefore, the full economic cost deficit from research must be viewed in the context of the overall university strategy and management.
- Universities also use their own funds and income crossflows in other activities to generate an appropriate level of surplus and support their overall financial sustainability . This differs from university to university according to their circumstances and activities they undertake.
Sustainability gap in UK and Scotland
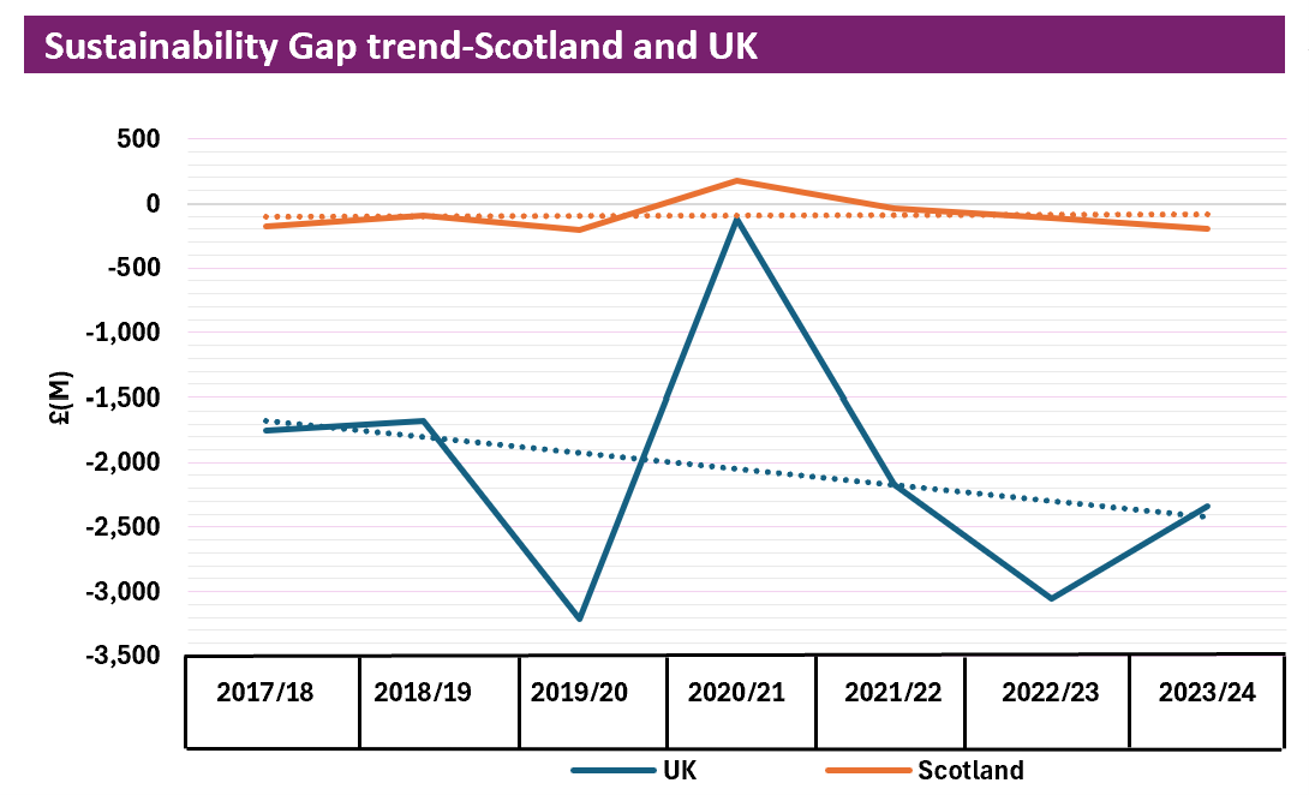
- To draw informative conclusions, it is important to look at trends over a four or five-year period. The impact of the pandemic from 2019-20 onwards should be considered.
- The graph below shows that the Sustainability Gap (FEC minus income) has been volatile, in part due to the pandemic and subsequent lockdowns, but with the overall trend being a gradual increase in the Sustainability Gap in Scotland and continued volatility in the Sustainability Gap at UK level in recent years with the gap in the UK reducing while Scotland’s gap has increased slightly in 2023-24.
Teaching Cost Recovery
- Of particular interest in recent years has been the financial performance of teaching. The graph below shows that the gap between Scotland and the UK in the recovery of full economic cost for publicly-funded teaching has narrowed slightly in recent years and the overall recovery of full economic cost across Scotland and the falling into line in 2023-24.
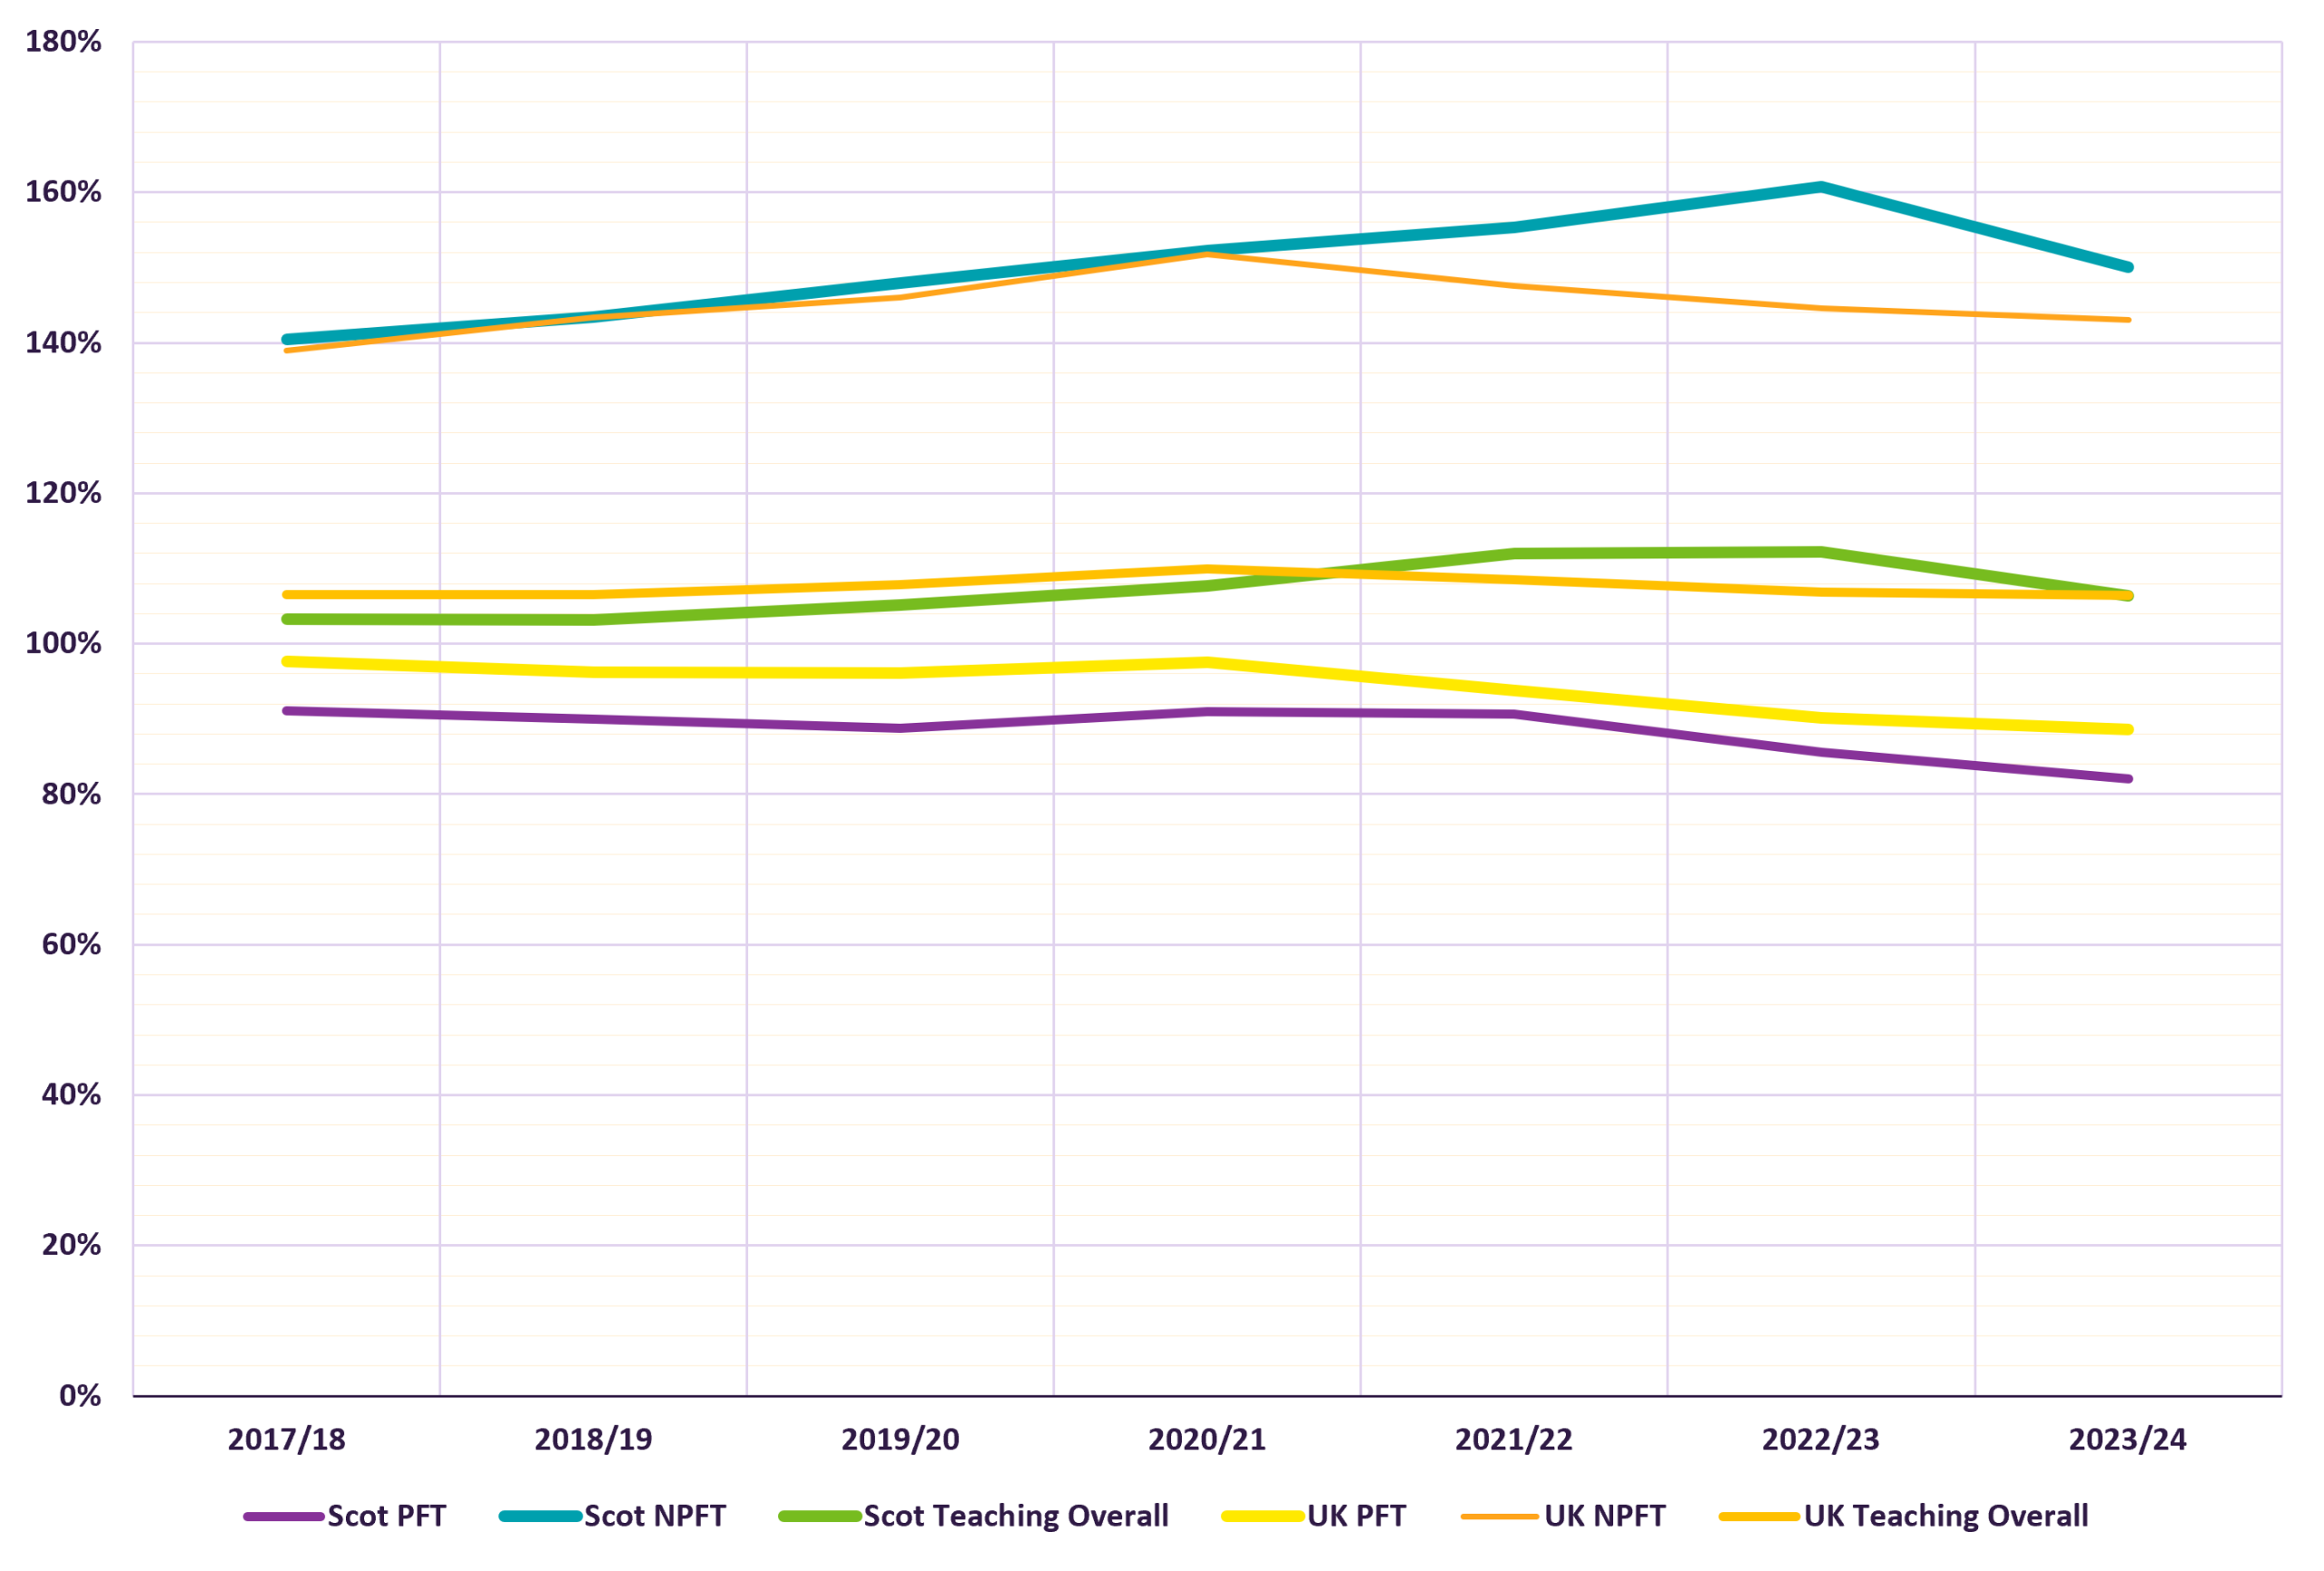
- Scotland’s full economic cost recovery in non-publicly funded teaching has steadily improved over the period to 2022-23 while the UK cost recovery has declined. This contributed directly to the slightly improved level of full economic cost recovery for overall teaching in Scotland against the UK level to 2022-23. The reduction in non-publicly funded teaching cost recovery in 2023-24 has seen UK and Scottish overall teaching cost recovery fall into line.
- Recovery of full economic cost is most successful through non-publicly funded teaching but as noted above this has seen a decline at both a Scotland and UK level in 2023-24. Non-publicly funded teaching full economic cost recovery is largely reliant on international student recruitment which is uncertain due to exposure to global macroeconomic and geopolitical issues and UK immigration policy.
Research full economic cost recovery
- The area with the lowest recovery of full economic costs is research activity albeit Scotland performs very slightly better than the UK. The graphs below break down the recovery on research in Scotland in 2022-23 and 2023-24 by research sponsor type.
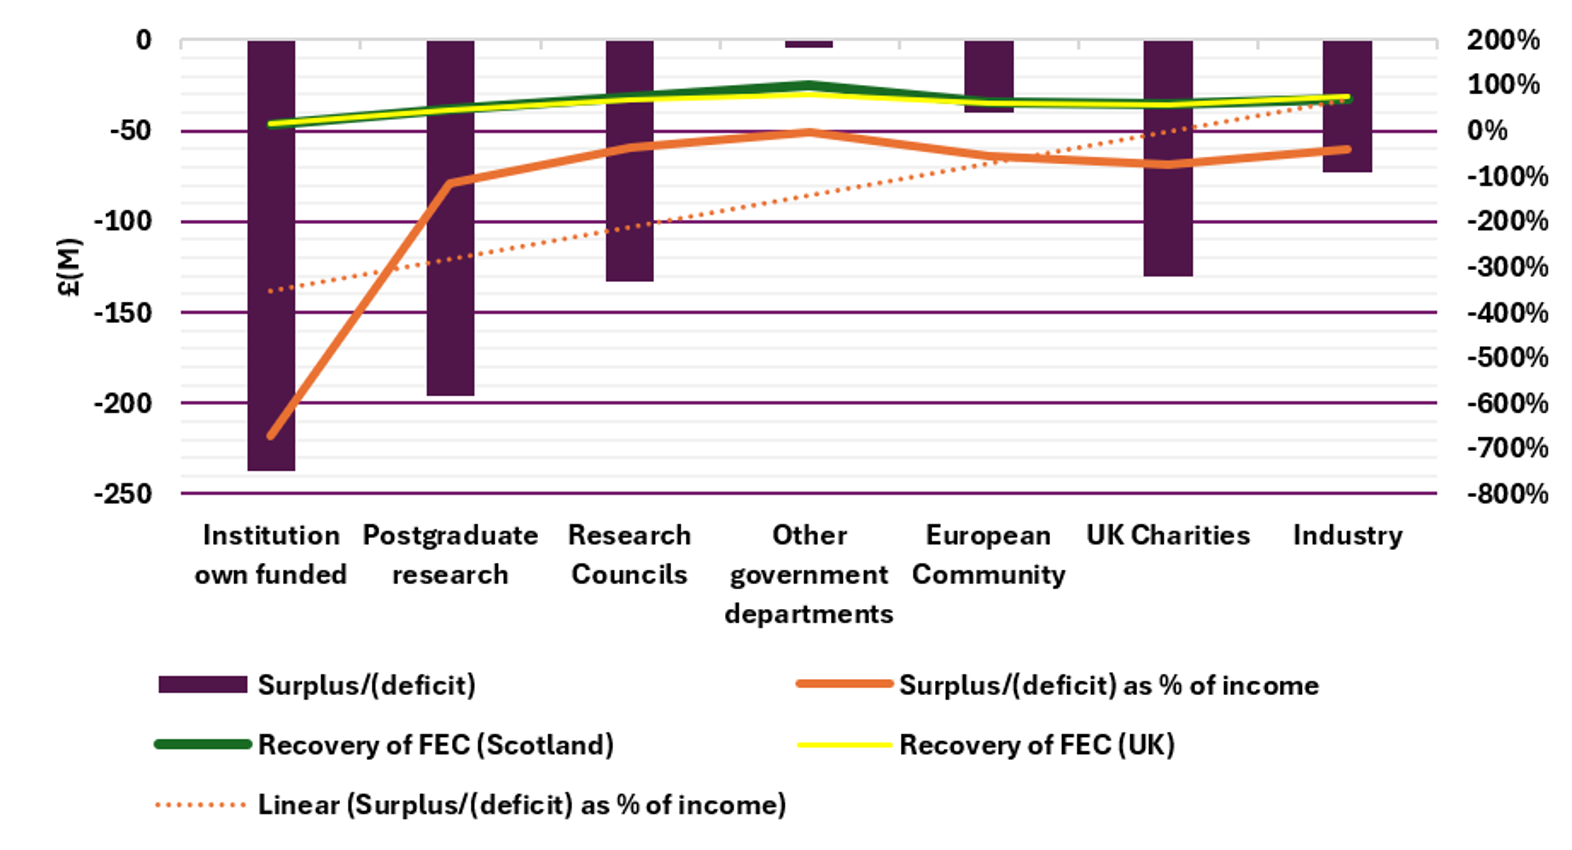
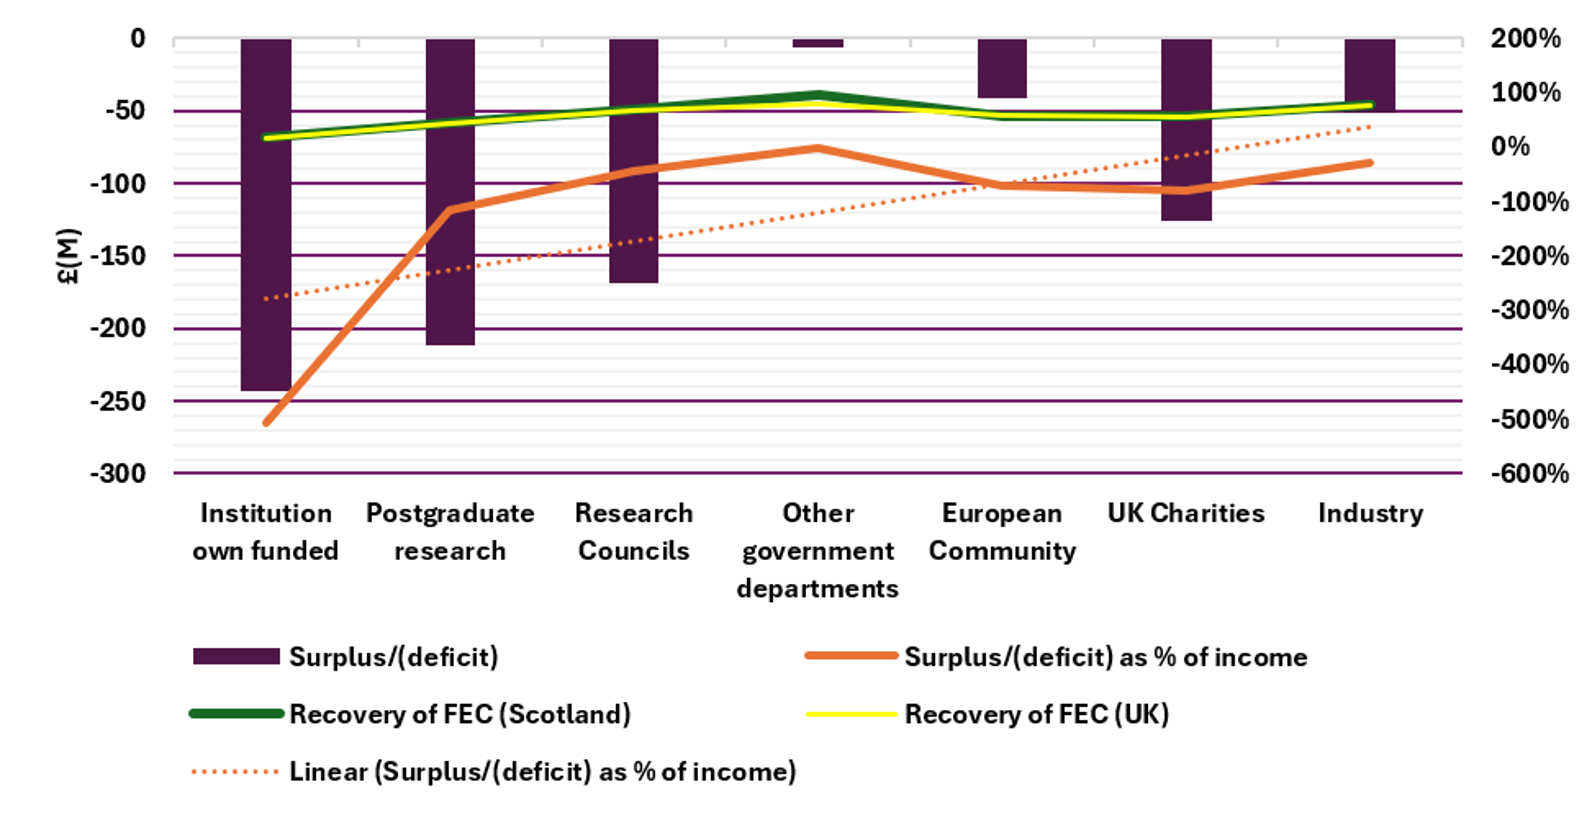
- The levels of full economic cost recovered vary by category of research sponsor. The extent of the contribution varies according to which organisation is funding the research. Research Council funding represents the largest sponsor of funding in volume terms and therefore has the largest impact. SFC provides research funding to Universities to support the cost of research – this funding was £283.7m and £265.8m per the TRAC data in 2022-23 and 2023-24 respectively.
- The reasons for this vary. In some cases, certain funders do not fund overheads or require an element of matched funding from the university. The differential rates of full economic cost recovery may lead universities to become more selective about the research funders they choose to work with due to the impact on financial recovery. However, it is challenging for universities to maintain optimal full economic cost recovery on research activity due to the limited portfolio of funders, projects spanning over several years, and the need for continued support from other activities to support the wider cost base.
Further information
- If you have any queries or require any further information, please contact Institutional Financial Health, email: ifh@sfc.ac.uk.
Tiffany Ritchie
Director, Finance
1 All universities in the UK use the Transparent Approach to Costing (TRAC) methodology for costing their activities. TRAC was introduced in 2000 with a view to improving accountability for the use of public funds for research and to inform university decision making. TRAC was subsequently extended to other university activities, including teaching. The methodology for calculating TRAC was adjusted in 2015-16 to reflect changes resulting from the introduction of the FRS 102 accounting standard.

SFC Strategic Plan 2022-27
Building a connected, agile, sustainable tertiary education and research system for Scotland.